Algorithm and Backtest

When I became interested in Momentum, my idea was to simplify the time spent investing as much as possible. Being an engineer, I sought to develop an algorithm that analyzes a list of stocks (over 500 in the USA and nearly 300 in Europe) and tells me which ones are the most interesting to buy.
The classic Momentum strategy based on the performance of the last 3, 6, and 12 months did not satisfy me, so I looked for a more interesting configuration by examining daily, weekly, and monthly changes.
Survivorship Bias
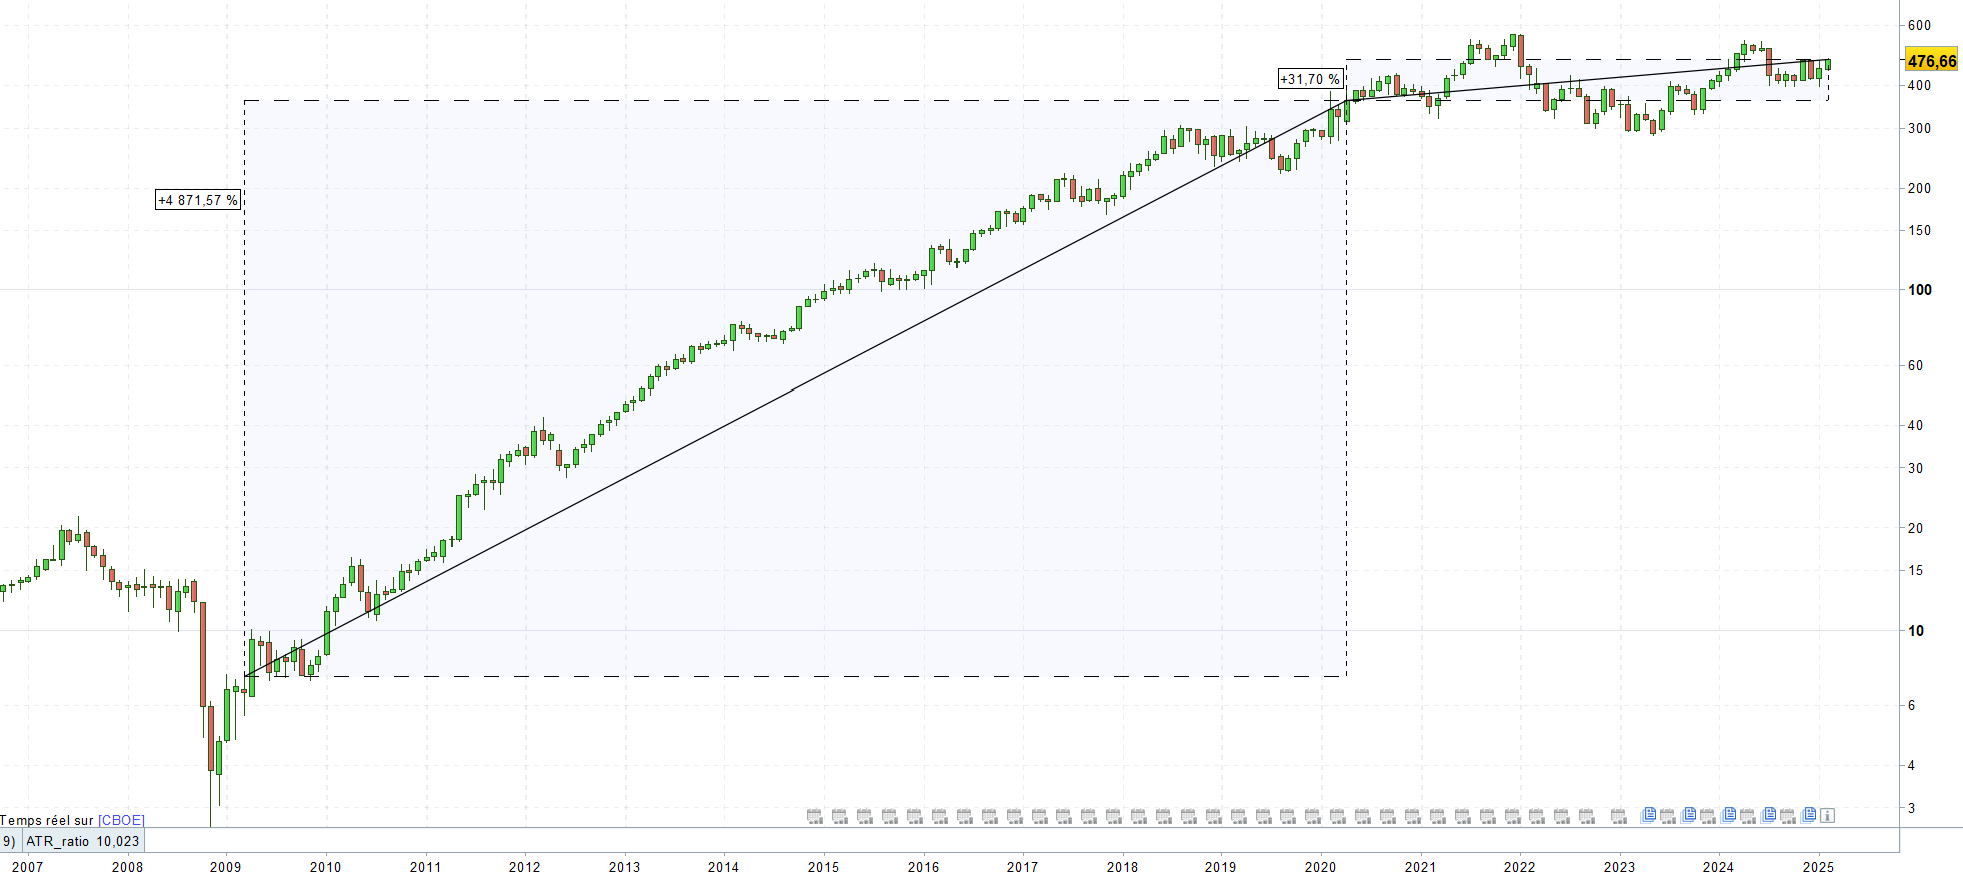
It was important to use consistent stock values without survivorship bias. This bias occurs when we take a basket of "surviving" stocks, like Domino’s Pizza for example, which is part of the S&P 500 in 2024, and then look at what the algorithm would have done with this basket of "surviving" stocks since 1995. The problem is that Domino’s Pizza has only been part of the S&P 500 since May 2020! It has had a 40% annual upward trend from 2008 to 2020 (or 4800% in total), and 4% per year from 2020 to 2025 (or 30% in total)! We can see the performance bias this can generate.
From my experience, the performance of a backtest is doubled for a 20-year backtest if no mechanism is put in place! Indeed, one can find backtests on the internet, but often they do not take this bias into account, and it becomes easy to think you have found a foolproof strategy with 50% returns or more! Therefore, I had to use, for each month and year of the backtest, a list of the stocks included in the index for that particular month or year.
Optimization
Then, during many evenings and weekends of work spread over almost a year, I performed what is called a backtest, to verify if this proprietary algorithm applied to stock values over the last 20 or 30 years was relevant over time, and whether it applied well to both the American and European markets. To do this, I had to test many different configurations, with backtests for each configuration in order to find the one that achieves the best performance with the most acceptable volatility for a given number of stocks over the last 20 or 30 years.
I also worked to optimize the algorithm so that stock changes occur as infrequently as possible. To do this, I had to identify the stocks with the most potential to remain in the portfolio for at least a few months. The result was an average of 27% turnover of stocks each month. So, for a portfolio of 10 stocks, on average 2 to 3 stocks will be sold each month, and 2 to 3 stocks will be bought each month. This minimizes the rebalancing work and the fees, thus also increasing performance.
This algorithm also has the advantage of automating the analysis to avoid any psychological bias. Indeed, I used to follow my instinct when investing, which was not always wise and caused me stress when making decisions like "Should I sell/buy?". Now, through this algorithm, I know that over the long term (a few years), the investment decision will likely be positive, which frees up time for other things, thus also increasing the hourly return (return relative to time spent).
Stock Basket for the Backtest
For information, the stock basket I used for my backtest is as follows for the USA:
- S&P 500 (500 largest listed companies in the USA)
And for Europe:
- SBF120 (120 largest listed companies in France)
- DAX 40 (40 largest listed companies in Germany)
- BEL 20 (20 largest listed companies in Belgium)
- IBEX 35 (35 largest listed companies in Spain)
It was quite difficult to find reliable stock data on the additions and removals of stocks in the index without exceeding the budget. I thus excluded the Nasdaq (tech companies listed in the USA), AEX 25 (Netherlands), MidDAX (completes the DAX 40 in Germany), or STOXX 600 (Europe). I also limited myself to the largest market, which is the Eurozone, so I excluded the UK and Switzerland, for example. Indeed, even with a low-fee account, alternating between different currencies incurs exchange fees that are not negligible, so it's better to avoid them as well as complicating rebalancing.
I also removed duplicates like ASML, which is present on multiple markets. The idea is to prioritize liquid stocks, which are easily available in traditional accounts and if not, in a standard brokerage account.
Stock Basket for Portfolios
At the end of this backtest, I was able to create different portfolios that I offer on this site and through this newsletter, composed of a selection of 5, 10, 15, or 20 stocks, based on the indices mentioned above and complemented. Therefore, for the USA (with 500 values):
- S&P 500
And for Europe (with nearly 300 values):
- SBF120 (120 largest listed companies in France)
- DAX 40 and MidDAX (90 largest listed companies in Germany)
- BEL 20 (20 largest listed companies in Belgium)
- IBEX 35 (35 largest listed companies in Spain)
- AEX 25 (25 largest listed companies in the Netherlands)
One might criticize the SBF120 or MidDAX for containing “small” stocks with a market capitalization of less than a billion, which is true, but this applies to only about ten stocks in these two indices at the time of writing, so I consider these stocks liquid enough for a small investor. It will always be possible to exclude these stocks from the selection if needed.
Moreover, backtests with the SBF120 or just with the CAC40 showed much better performance with the SBF120 (for example, the gross performance for a 10-stock portfolio drops to 18% with only the CAC40 compared to 26% with the SBF120!).
Log or Linear Scale Graphs?
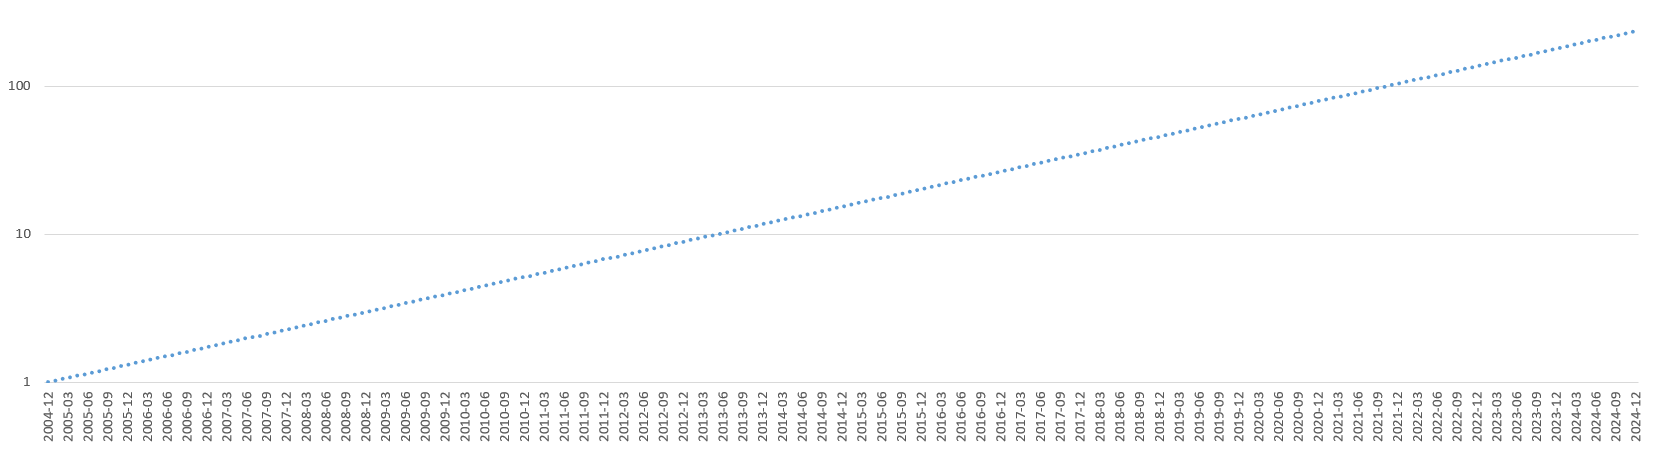
Most of the graphs presented later will be in log scale, as it provides the best way to assess performance over time. Furthermore, a trend with compound interest (2.3% per month in this example) appears as a straight line in log scale, which makes it very easy to read.
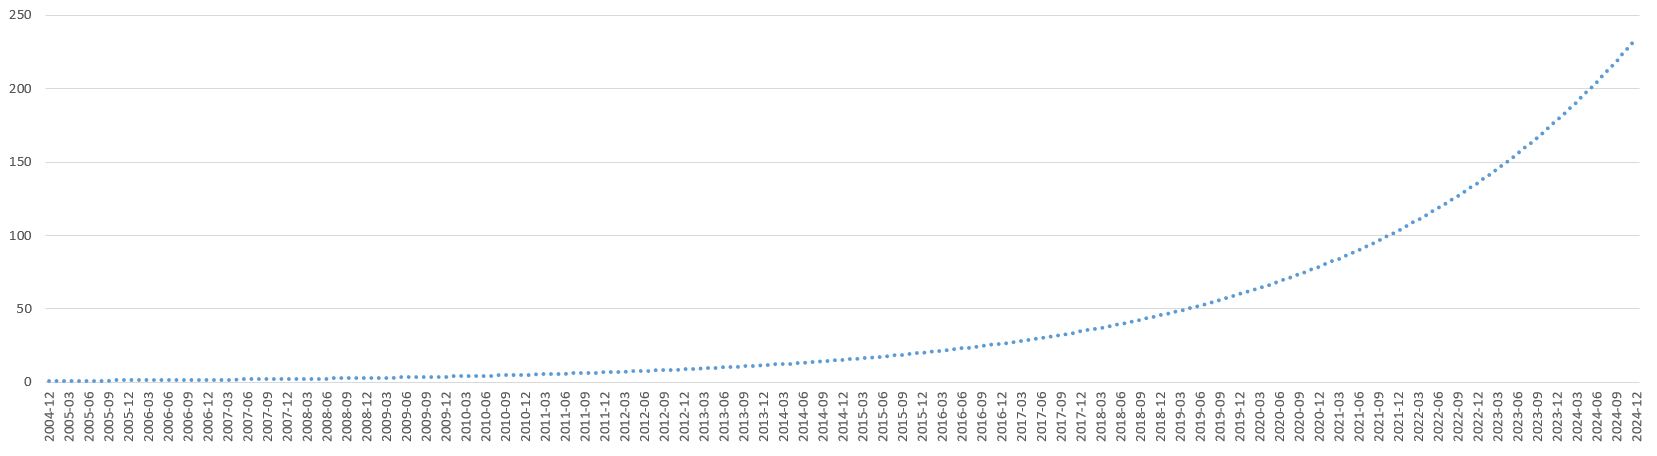
In comparison, here is a graph in linear scale with the same data, over the same period of time. It's impressive but impossible to draw any conclusions from it; at the beginning of the graph everything is compressed at the bottom, and at the end of the graph everything is compressed at the top.
Limits of the Backtest
A few limits of this backtest should be highlighted:
- During a rebalance, for the example of a portfolio with 10 stocks, each with 10% invested in each stock, after a month one stock may have gone up or down. My backtest accounts for this performance but considers (to simplify the calculations) that the portfolio is rebalanced “for free,” so if a stock has outperformed, a small portion of the capital invested in that stock will be considered sold, and this capital will be redistributed among the other stocks proportionally.
- The algorithm also assumes that all stocks can be bought in fractions, so a €10,000 portfolio invested in 10 stocks and positioned on a stock with a unit price of €1500 will have 0.66 shares, which is not possible in practice. Therefore, it is sometimes difficult to position on certain stocks.
- The backtest is performed ignoring the €/$ effect, so the performance for a portfolio in the USA will be in dollars and will be impacted if the funds are converted back into euros. I believe it's unrealistic to try to predict the €/$ exchange rate, as it mainly depends on geo-political decisions.
- The values used are the closing prices at the end of the month, but in practice, purchases and sales will take place the following day with a slight gap (up or down).
- Some stocks have merged or been delisted, like Yahoo, which was partially acquired by Verizon and Altaba and whose stock data is no longer easily available today (unless paying for a data license worth thousands of euros, of course). These stocks are thus absent from the backtest.
Next article: Anti-drawdown System