Anti-drawdown System

Drawdown refers to the maximum loss that a portfolio can experience, starting from its highest point. It is a way to measure how a portfolio behaves during a financial storm. The most glaring example is the 2008 crisis, which lasted one to two years.
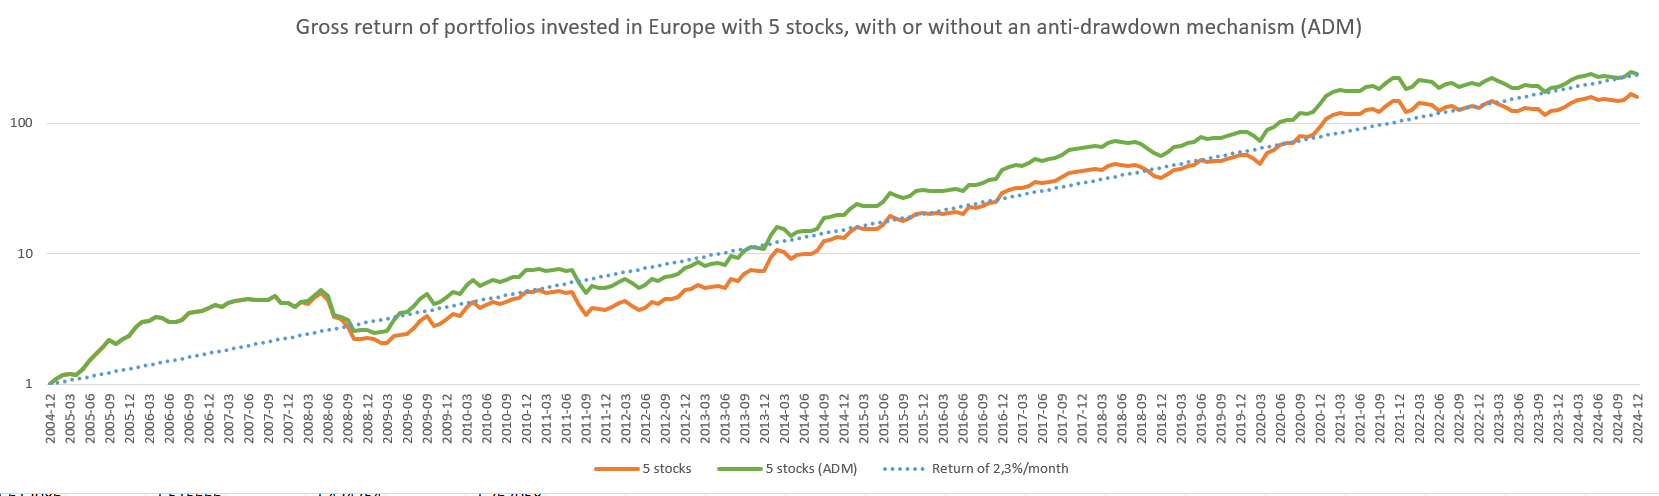
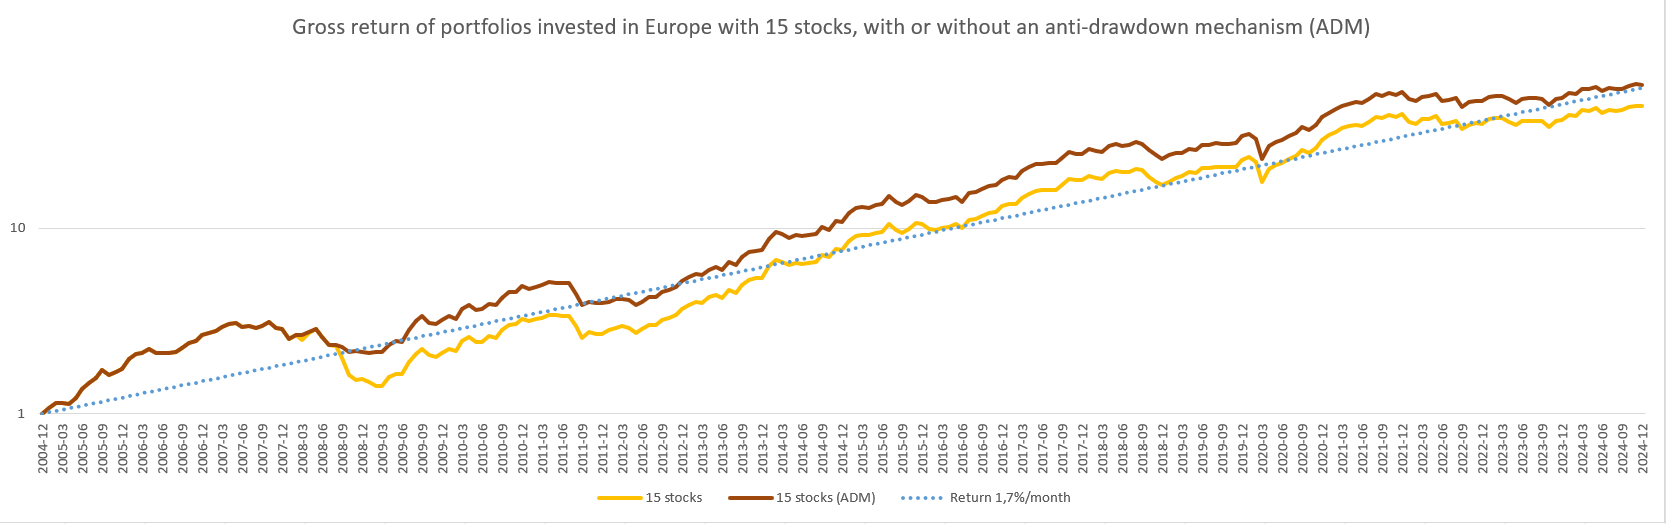
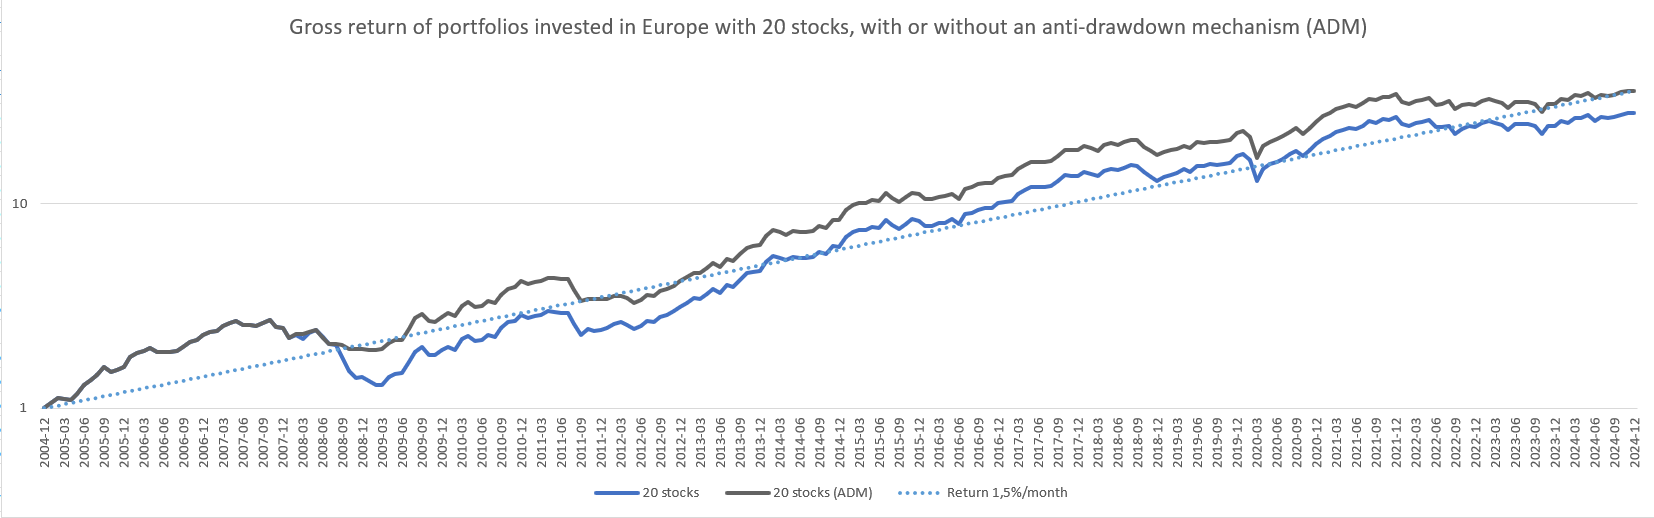
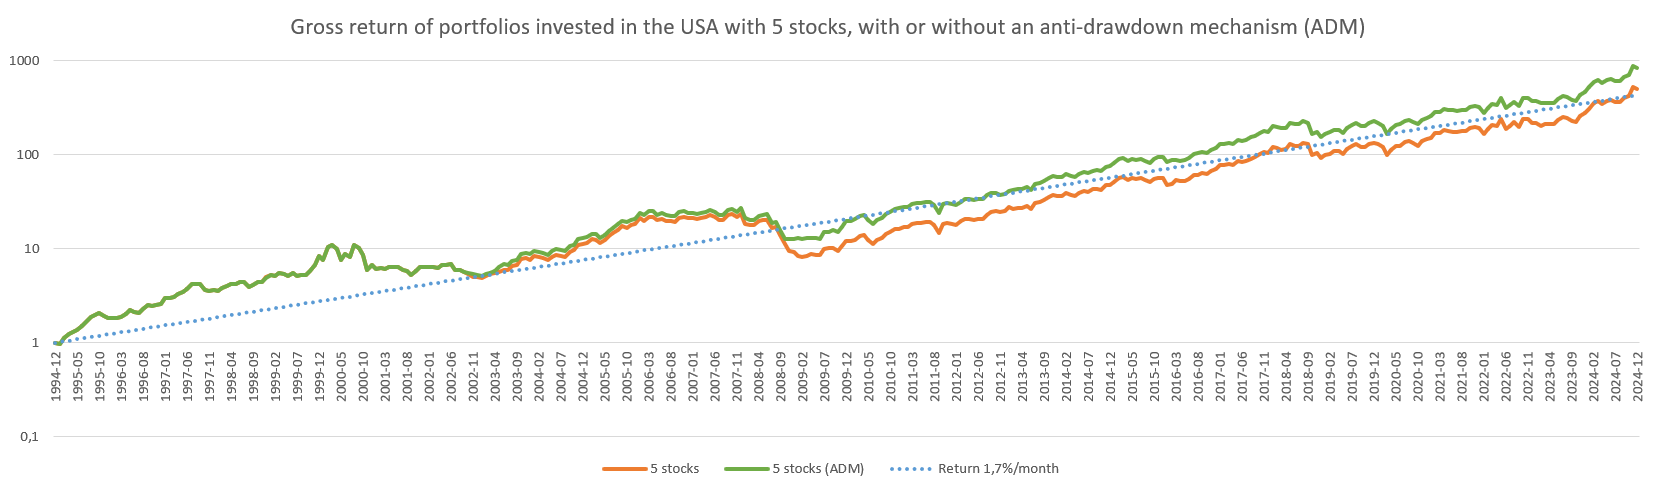
To avoid this, I implemented an anti-drawdown mechanism (ADDM) within the algorithm that helps avoid participating in prolonged market downturns over several months, at the cost of a slightly lower performance. The following graphs show how it works. Most of the time, the performance is similar, except for the 2008 crisis, which is avoided thanks to this mechanism.


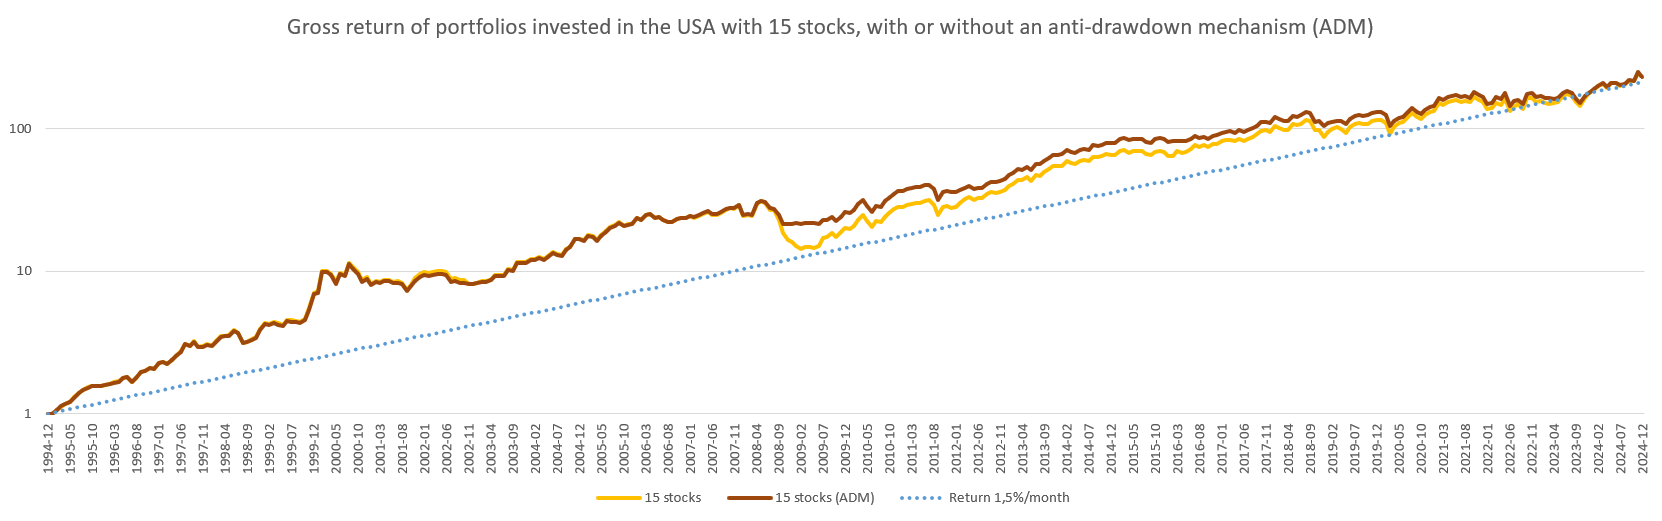
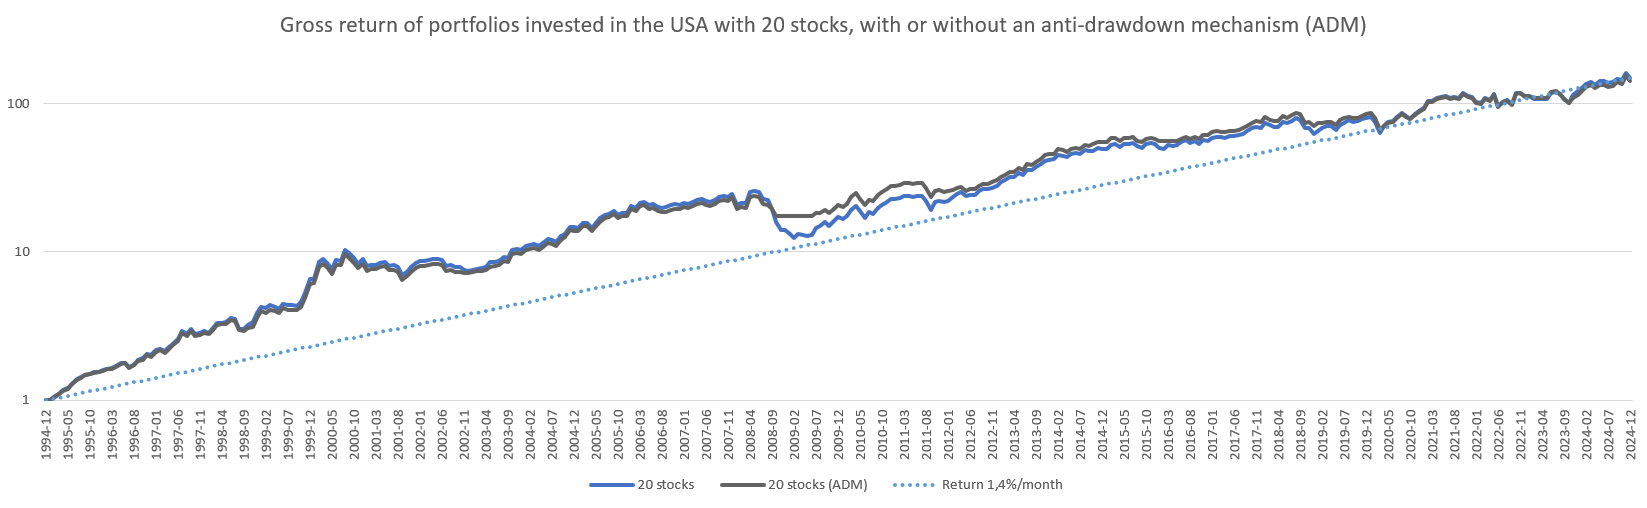
Impact of anti-drawdown mechanism on Performance
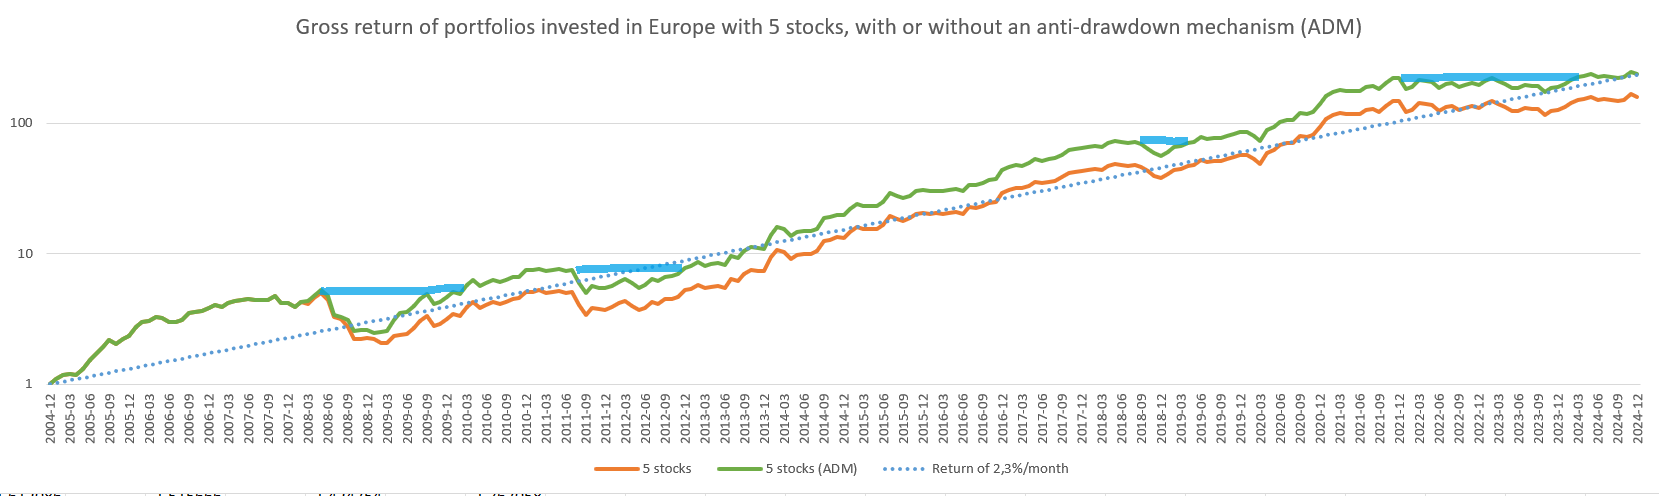
It should be noted that since the backtest starts in 2005 in Europe, and the 2008 crisis happens shortly after the backtest begins, the anti-drawdown mechanism benefits from this and the performance is systematically higher in Europe. This is a statistical bias due to the difficulty of easily reconstructing the European stock basket from 1995 to 2005.
In summary
What you should simply remember is that this mechanism acts as a kind of insurance that helps avoid major market downturns, such as the 2008 crisis, but not "flash" crises like the one in 2020. Its disadvantage (or cost) will be a slightly lower performance if no crisis like 2008 occurs, due to a tendency to regularly exit the market in an inefficient manner (a sort of false positive). However, we see that this tendency to exit the market regularly is very weak and has little impact.
Duration of Drawdown
Thanks to the backtest algorithm, it becomes possible to calculate the maximum duration during which a given portfolio has been in loss since its last peak.
Here is a summary table that shows the value of the anti-drawdown mechanism.
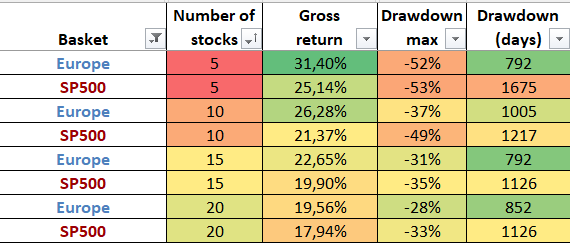
We can see that by following this strategy, in the worst-case scenario, we suffered a maximum of two to three years of losses, considering the first investment at the highest point.
And here is a graph to help with understanding, where I added some relevant periods, indicated in blue. For each of them, a peak was reached and wasn't surpassed until one or two years later.
Next article: Is it easy to invest via Momentum?