Portfolios and taxation

Different investment vehicles exist, specific to each country, so to avoid calculating each situation, I have limited myself to proposing typical cases of investment vehicles inspired by those available in France. Among them, I will mention:
- The "ModerateFeesModerateTaxes" envelope: A blocked account with moderate fees (0.3% on each purchase or sale of a stock) and moderate taxes on withdrawal (17.2%).
- The "HighFeesNoTaxes" envelope: A blocked account with high fees (0.6% on each purchase or sale of a stock, and 0.5% annually) and no taxes on withdrawal (0%).
- The "LowFeesHighTaxes" envelope: An unblocked account (free withdrawals) with very low fees (0.005%) and significant taxes each year (30%).
The "ModerateFeesModerateTaxes" envelope and the "HighFeesNoTaxes" envelope are typically a 401k or Roth IRA for Americans, while the "LowFeesHighTaxes" envelope is a standard brokerage account (e.g., eToro, Degiro, etc.).
One might think that with monthly rebalancing, it would be best to prioritize the "LowFeesHighTaxes" envelope, but after calculating, I quickly realized that it is better to pay higher fees but benefit from reinvesting the profits without paying taxes immediately, or even not paying taxes at all. Indeed, if you aim for 10 to 20 years of investment followed by a disinvestment phase where you pay the taxes due (at the end), this would essentially mean using the potential money designated for taxes to reinvest—sort of like a government loan!
The key envelopes for this are the "ModerateFeesModerateTaxes" and "HighFeesNoTaxes" (blocked account, low to high fees, light taxes or no taxes on withdrawal), provided they allow direct investment in stocks. If this is the case, it might be wise to allocate a certain percentage of the portfolio to them.
Finally, the default solution is the "LowFeesHighTaxes" envelope, meaning a regular brokerage account, with very low fees, and taxes every year.
It should be noted that, to simplify my calculations, I only considered the capital gains tax, intentionally ignoring a few years of carryforward losses that would have reduced this tax. The performances below should theoretically be slightly better, but marginally, because in the end, we observe few years with capital losses.
I also did not consider withholding tax on dividends, which varies by country and year!
The Sharpe Ratio
This ratio measures the relationship between expected performance and the associated risk (volatility). The higher the Sharpe ratio, the more attractive the investment is in terms of the risk taken. I encourage you to read this article for more details on its calculation. Here, it is calculated considering a risk-free rate of 2%. Be cautious, as some often use a 0% risk-free rate, which can be misleading...
Comparison
After these explanations, here is the table comparing the different portfolios of interest. I have added a few portfolios available on the market for comparison (DAX ETF, SP500 ETF, Warren Buffet’s Berkshire Hathaway), and filtered the table based on performance after taxes (on the left) and the Sharpe ratio, which links performance to risk (on the right).
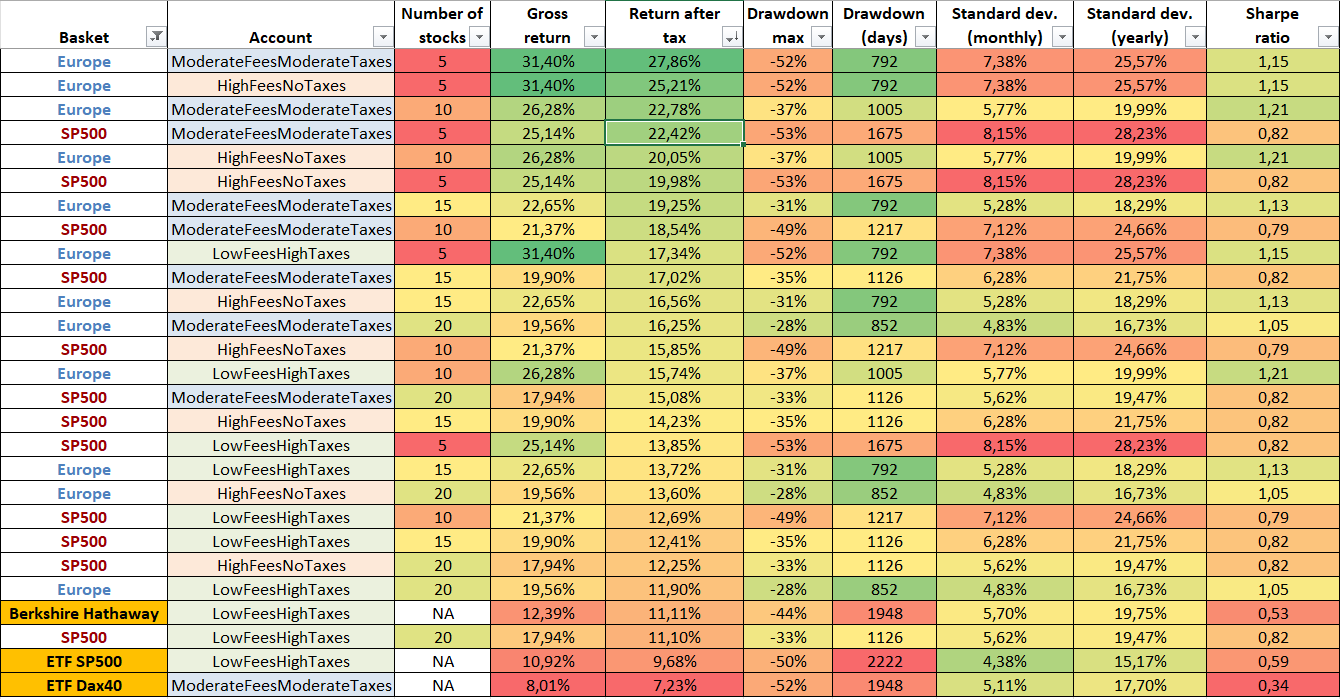
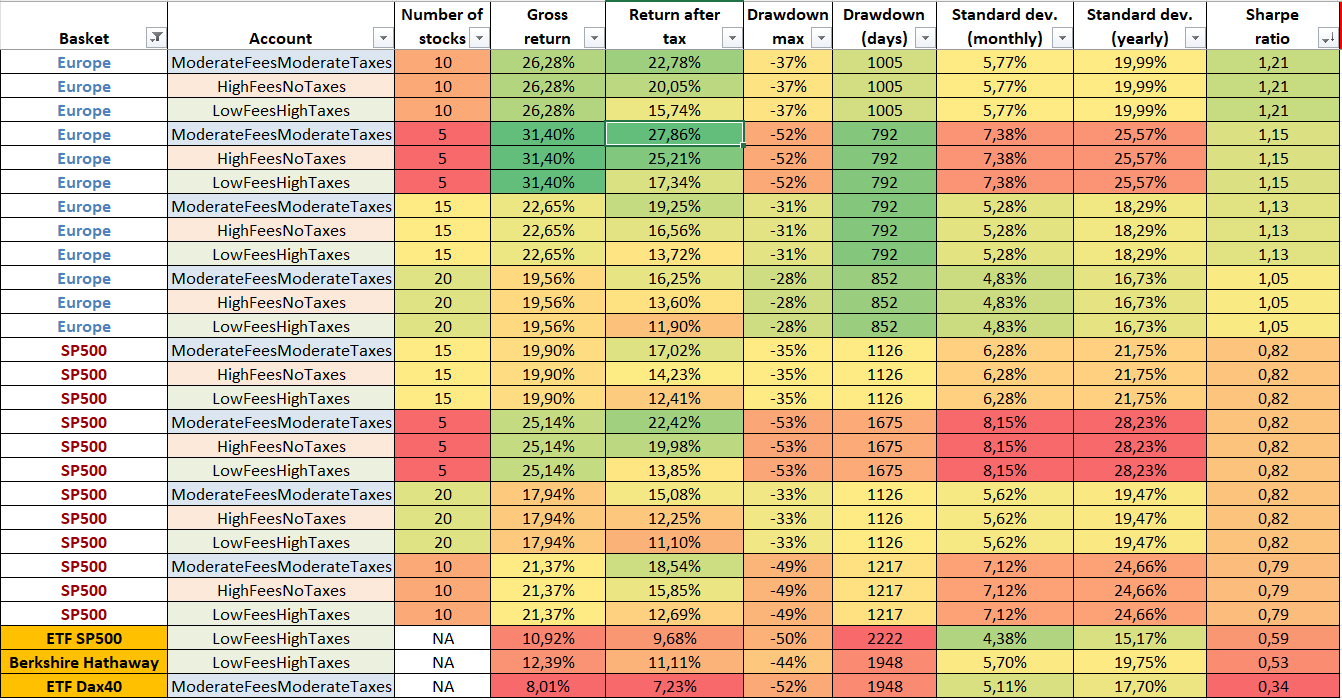
In these tables, you can see the different portfolios with all possible tax envelope configurations.
Notably, we observe that:
- Europe beats the US, but this is probably due to the choice of dates used for the backtest. I wanted to start with a round figure year, like 1995, 2000, or 2005. However, 2000 is a peak, so it's not representative, and 1995 is too old for European values (many of them were delisted, skewing the results upward). In the end, I chose 1995 as the starting year for the SP500 and 2005 for Europe.
- ETFs are the poorest performers, both in terms of performance and Sharpe ratio.
- A portfolio of 20 stocks invested in the SP500 has the same after-tax performance as a Buy & Hold investment in Warren Buffet’s Berkshire Hathaway fund, but with slightly less volatility and drawdown.
- Portfolios of 5 stocks are the most risky but also the most performant.
- A portfolio invested through the "ModerateFeesModerateTaxes" envelope or the "HighFeesNoTaxes" envelope tends to outperform a portfolio invested through the "LowFeesHighTaxes" envelope, thanks to profits being reinvested without paying taxes immediately.
Thus, overall, the ideal configuration for achieving good performance and moderate volatility (or standard deviation) is a portfolio of 10 to 15 stocks invested in Europe or the US, preferably through the "ModerateFeesModerateTaxes" or "HighFeesNoTaxes" envelope, or alternatively through the "LowFeesHighTaxes" envelope.
Beware, as I repeat, the difference between Europe and the US is mainly due to different backtest dates. Do not view this as Europe being superior to the US; in fact, in recent years, the opposite has occurred.
Next article: The World Portfolio