Portfolios compared to indices

Annual Comparison
The idea here is to ask the question, "What performance gain can I achieve using Momentum each year compared to buying an index like the S&P 500 or DAX and holding it for 20 or 30 years?" This could also be rephrased as, "Will I be able to show off to my colleagues at the coffee machine every year because of superior performance?"
And the answer is... no! At least, not every year. On average, a Momentum strategy performs better, but there will be some years when you'll need to keep a low profile at the coffee machine.
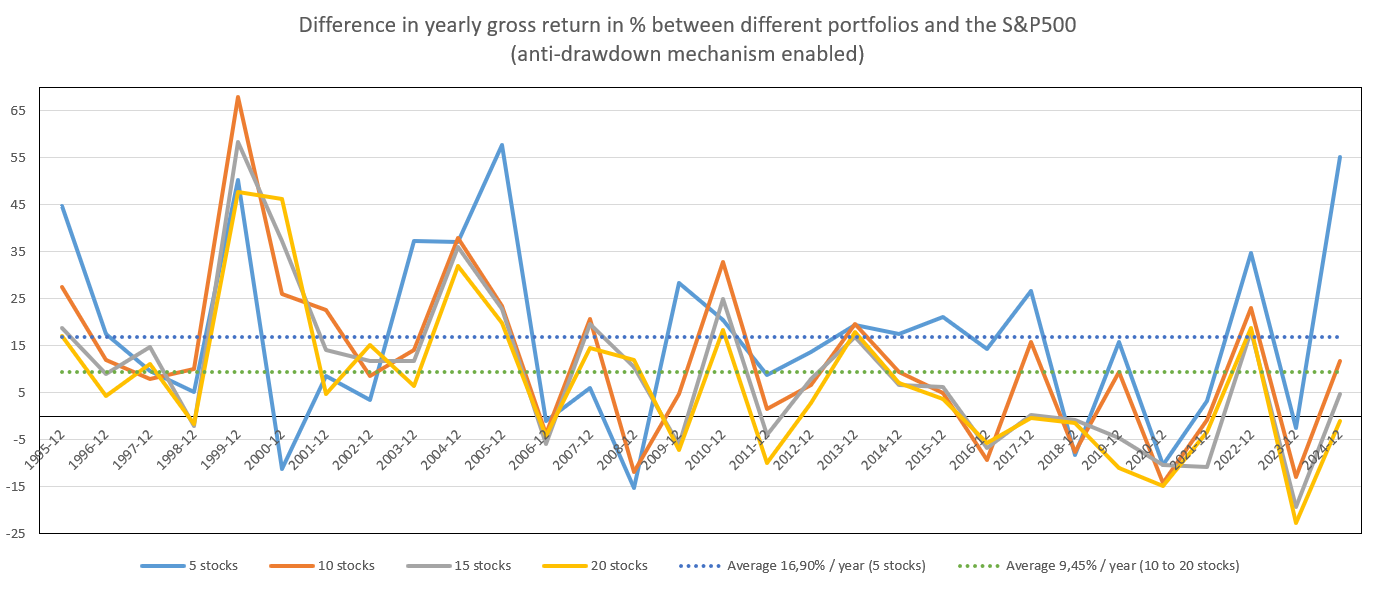
For example, on December 31, 2000, a Momentum strategy with 5 US stocks delivered an annual performance of -19%, compared to -10% for the S&P 500! But this same strategy then delivered annual performances of 66%, 47%, and 62% from 2003 to 2005! In comparison, the S&P 500 delivered annual performances of 28%, 10%, and 5% during the same period from 2003 to 2005.
Thus, an outperformance ranging from -9% in 2000 to 57% in 2005 is achieved (blue curve on the graph below).
By averaging these years, we can obtain the average annual gross performance gain over the S&P 500, which is about 9.45% for a portfolio of 10 to 20 stocks (green dotted line on the graph) and 16.90% for a portfolio of 5 stocks (blue dotted line on the graph).
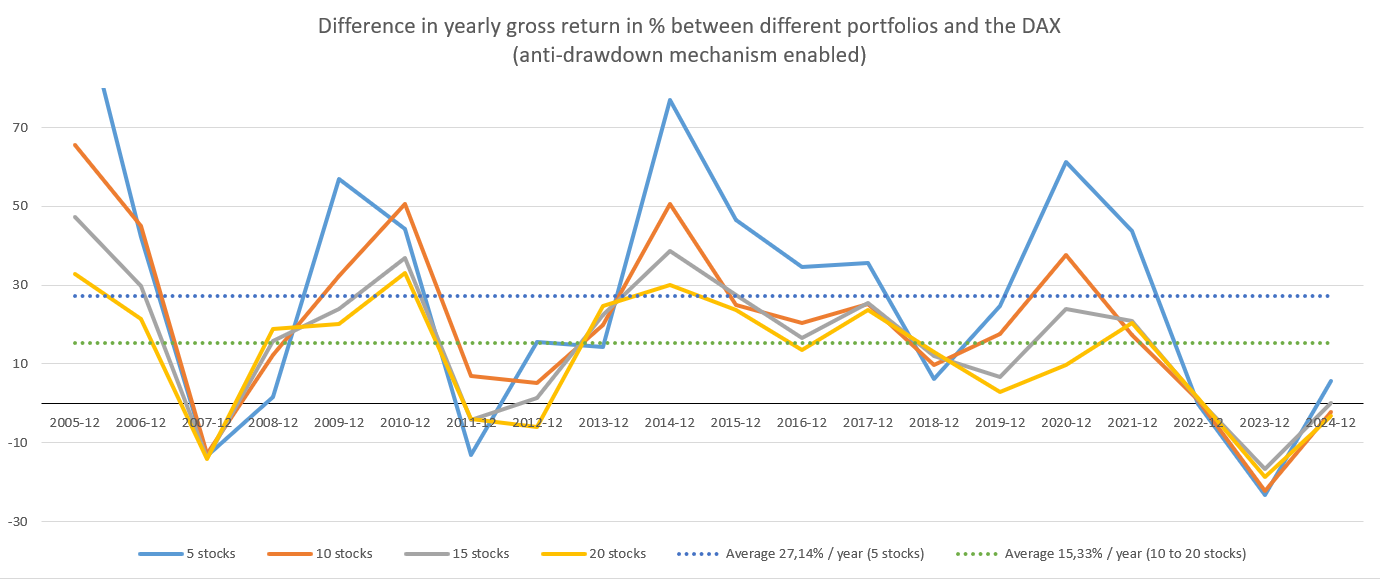
Finally, for Europe compared to the DAX, the observed average gain is about 15.33% for a portfolio of 10 to 20 stocks (green dotted line on the graph) and 27.14% for a portfolio of 5 stocks (blue dotted line on the graph).
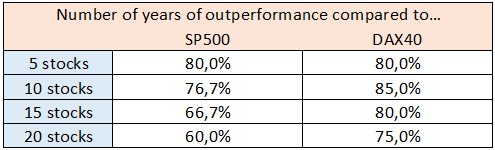
If we look at annual statistics, we also observe that the Momentum strategy delivered an outperformance 7 years out of 10 for both the US and Europe.
Of course, these comparisons should be taken with a grain of salt, as a performance from December 31 of year N-1 to December 31 of year N is not necessarily representative—there could very well be a peak or trough in the middle of the year. Furthermore, these are gross performances; fees and taxes will also affect the performance, but I’ve omitted them to simplify the comparison.
Also note, one might think it's better to invest in Europe because the average there is higher, but looking more closely, we also see that Europe has underperformed in recent years (2022 to 2024).
Monthly Comparison
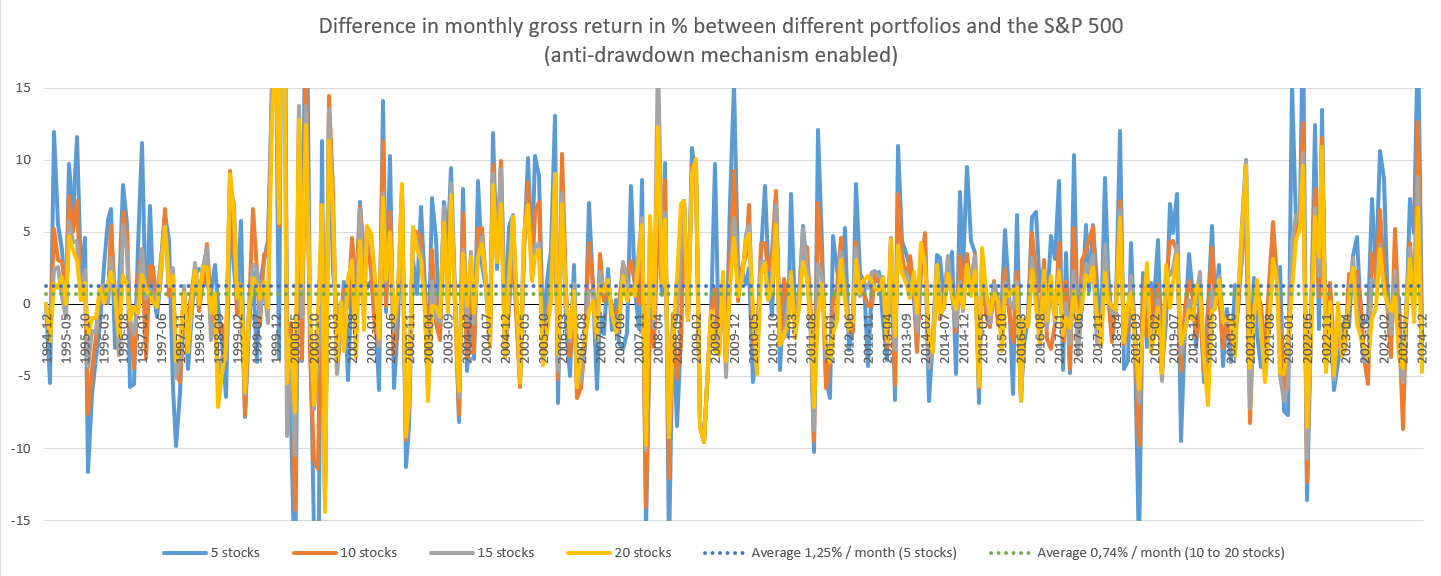
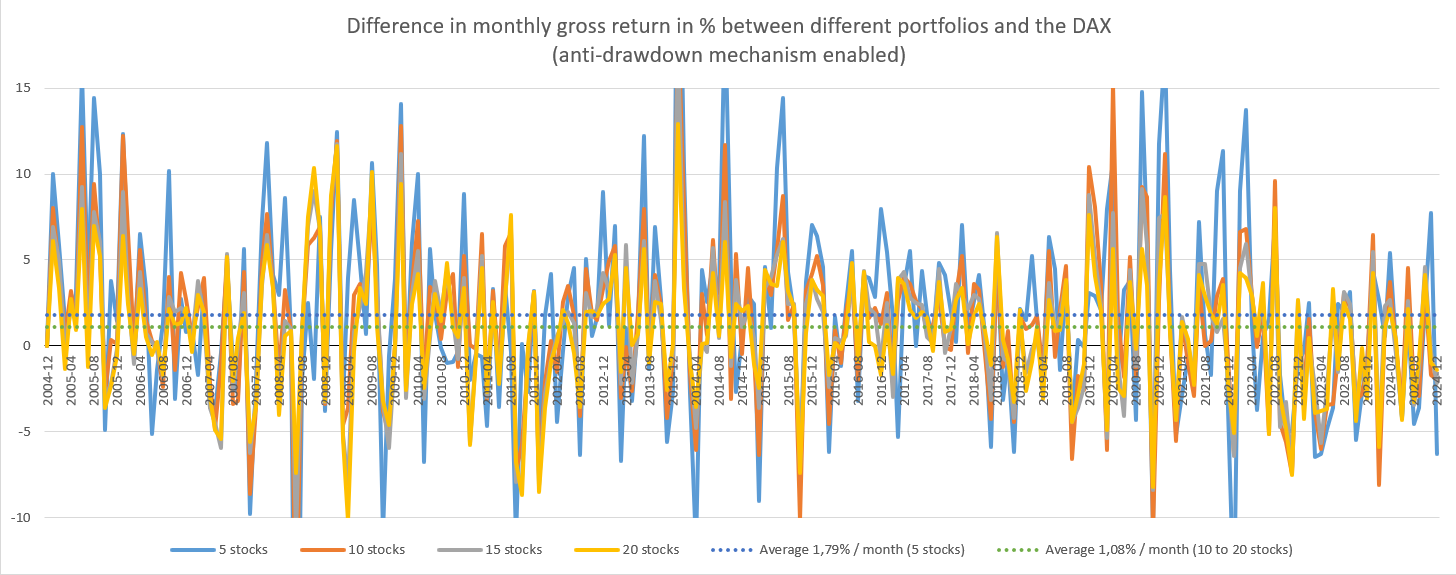
Pushing the reflection a little further, let's look at the monthly performance.
It’s definitely messier, but we can similarly average the months and get the gross outperformance, which in the US is 0.74% for 10 to 20 stocks (green dotted line on the graph) and 1.25% for 5 stocks (blue dotted line on the graph) compared to the S&P 500.
As for Europe, the average outperformance is 1.08% for 10 to 20 stocks (green dotted line on the graph) and 1.79% for 5 stocks (blue dotted line on the graph) compared to the DAX.
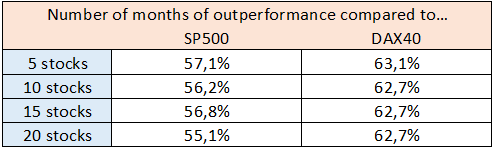
Looking at the number of months where the strategy outperformed the index, we again see that the Momentum strategy delivered outperformance about 6 months out of 10 for both the US and Europe.
Don’t forget that past performance is not indicative of future results! These values are indicators of past trends, not forecasts.
Next Article: Portfolios and Taxation