The World Portfolio

A strategy could be to mix a portfolio of Europe and a portfolio of the USA.
Here are some calculations for the period from 2005 to 2024, considering a portfolio with 50% in Europe and 50% in the USA. As expected, we obtain an average of the two, which can be interesting. In fact, these two markets are not always correlated, as is the case right now where Europe is not performing as well. It thus becomes possible to offset a decline in performance in Europe with better performance in the USA and vice versa, thus reducing overall volatility while maintaining performance, at the cost of a bit more rebalancing work (the number of stocks doubles mechanically).
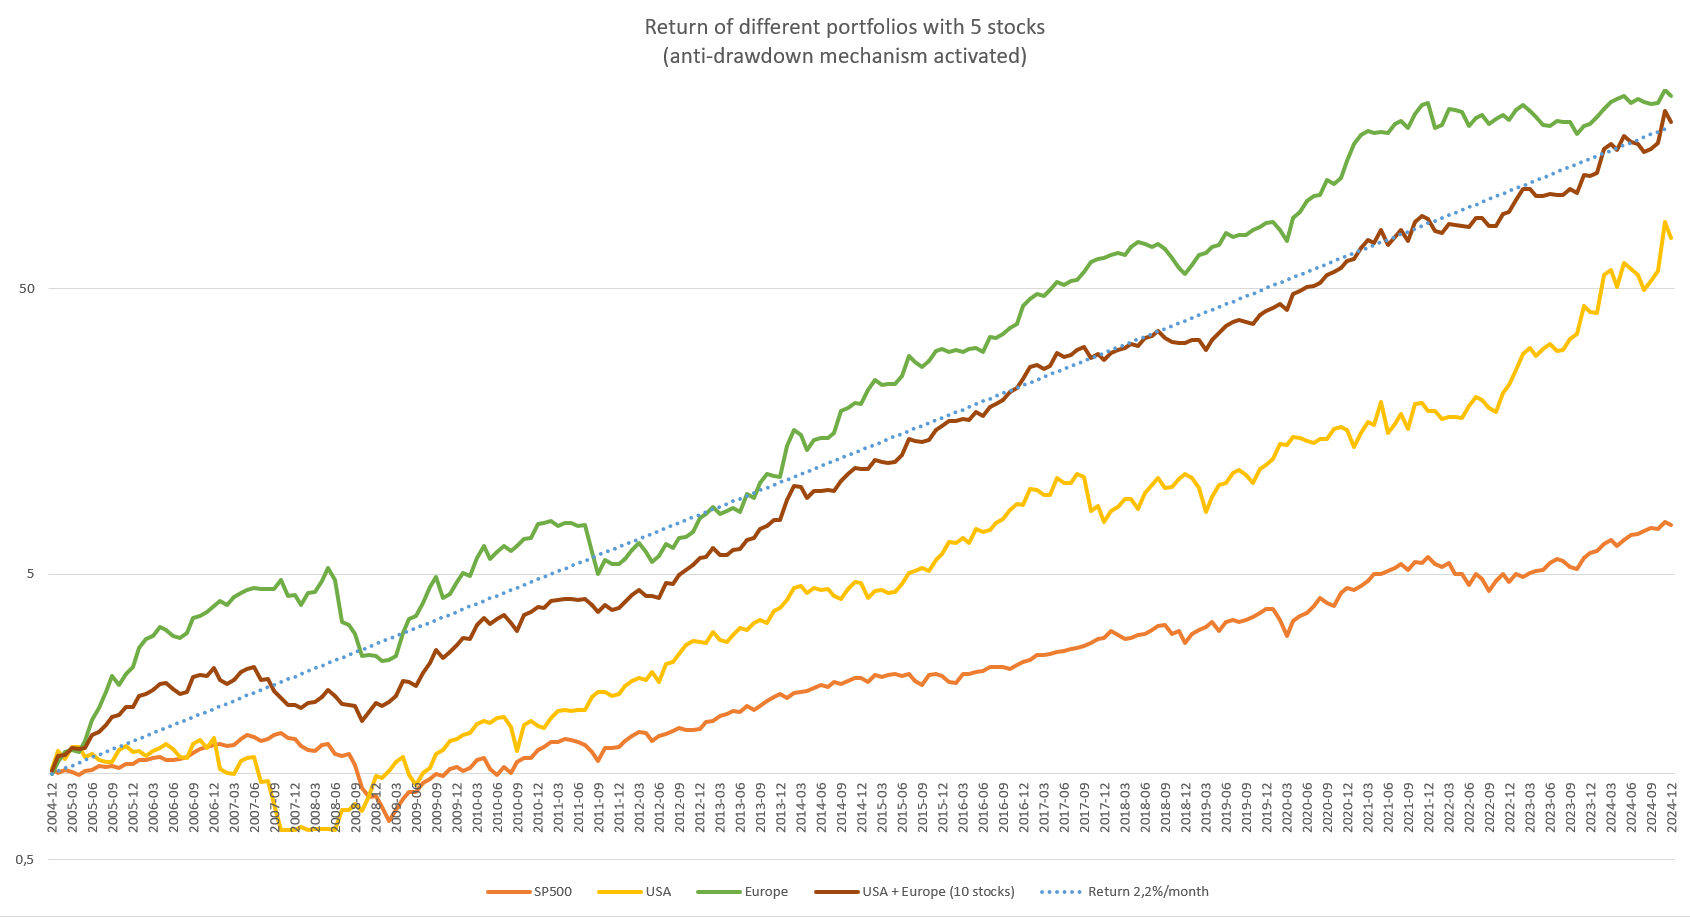
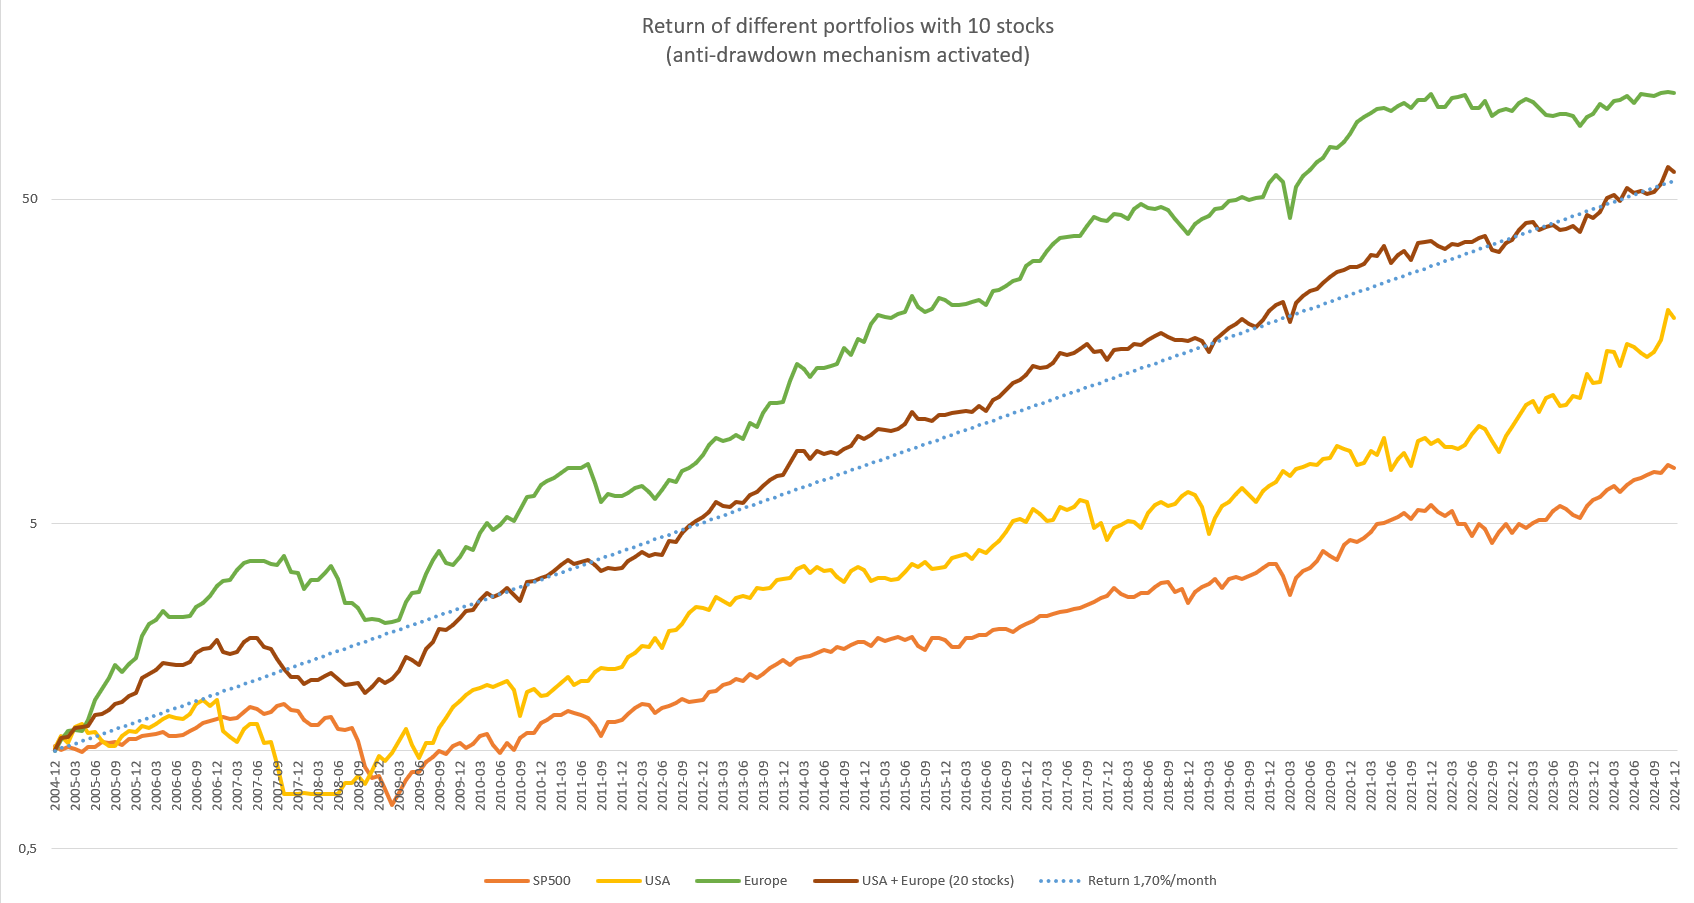
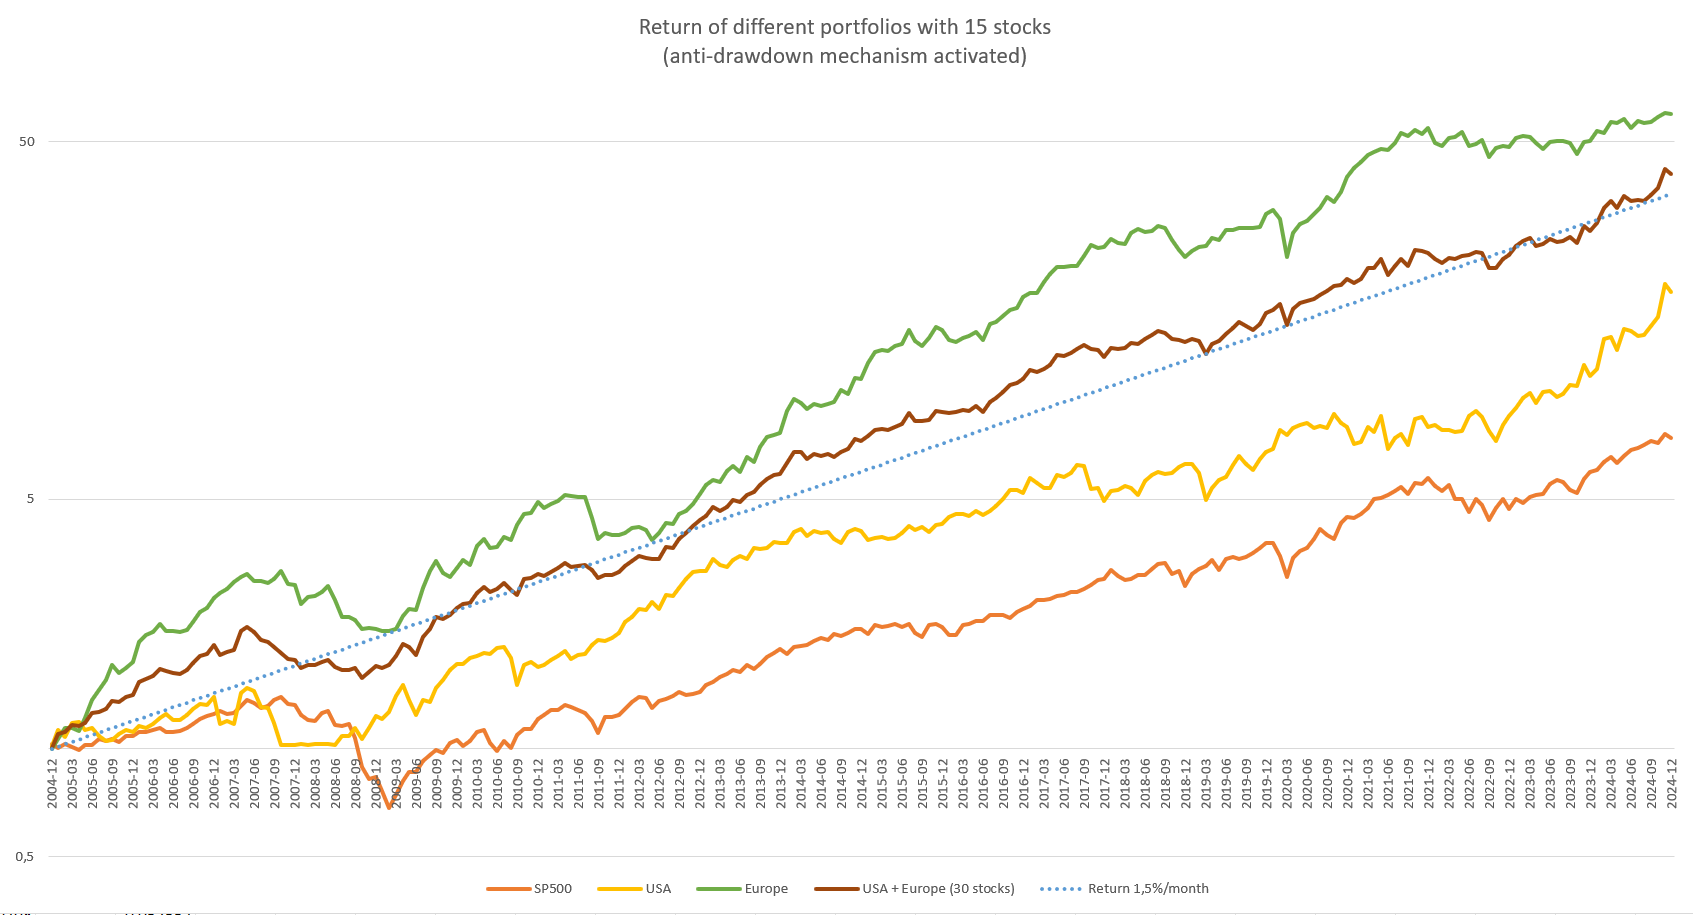
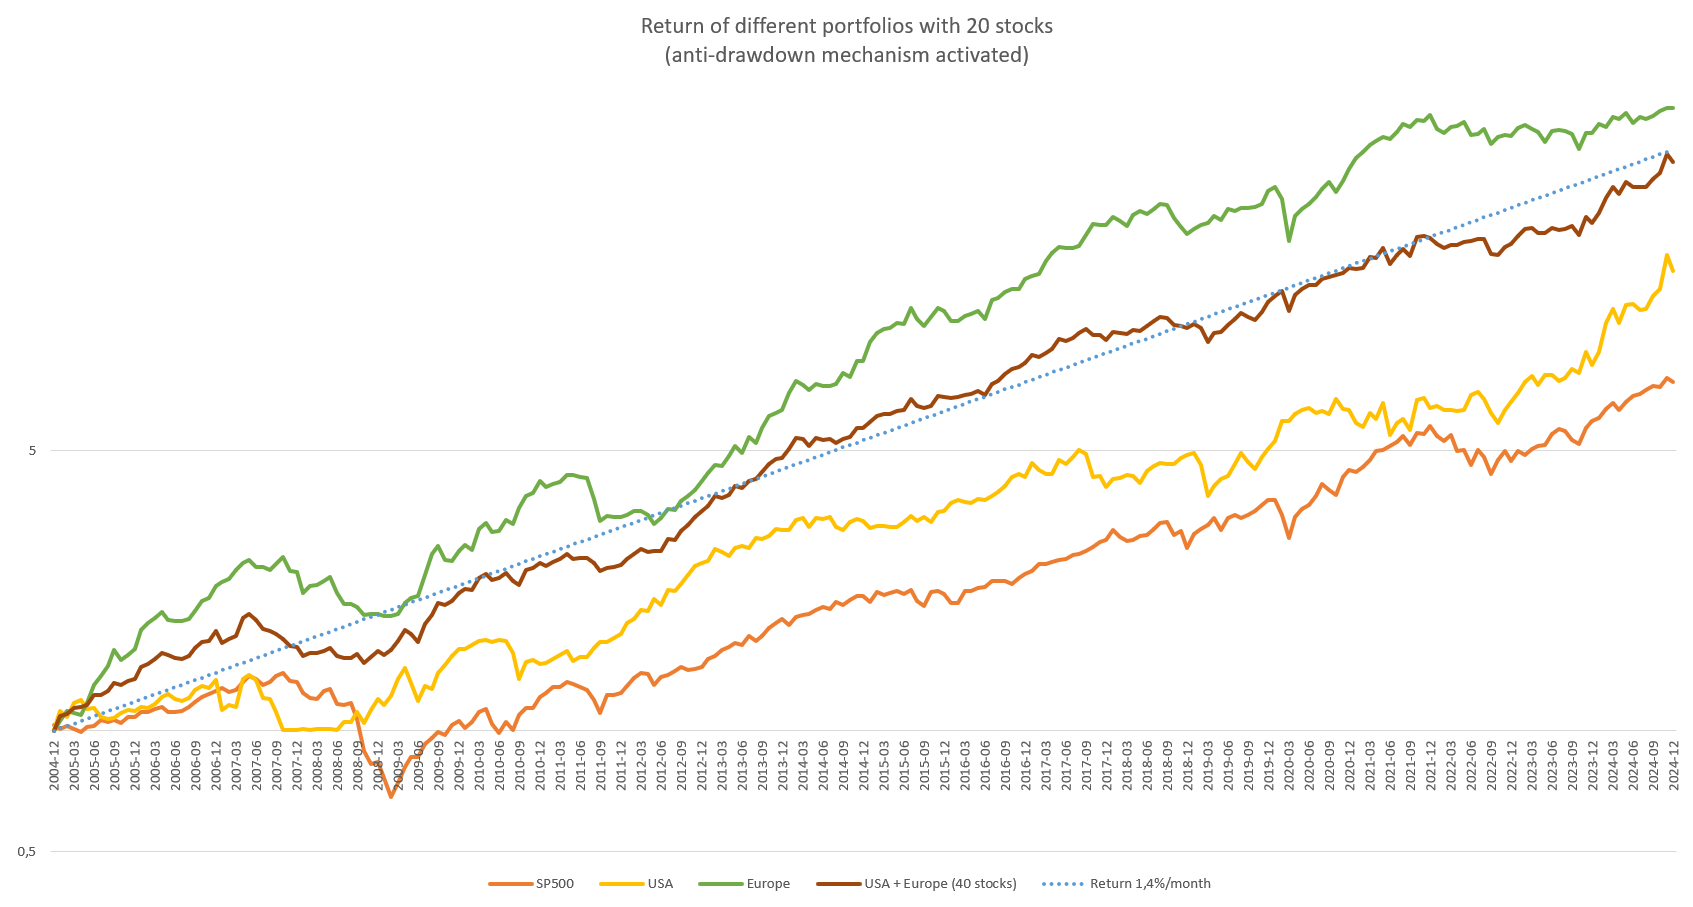
The trends drawn monthly provide an idea, with between 1.4% and 2.2% per month. Be careful, as a mix of Europe + USA from two 20-stock portfolios means a total portfolio of 40 stocks, which starts to represent quite a bit of work each month!
Outperformance
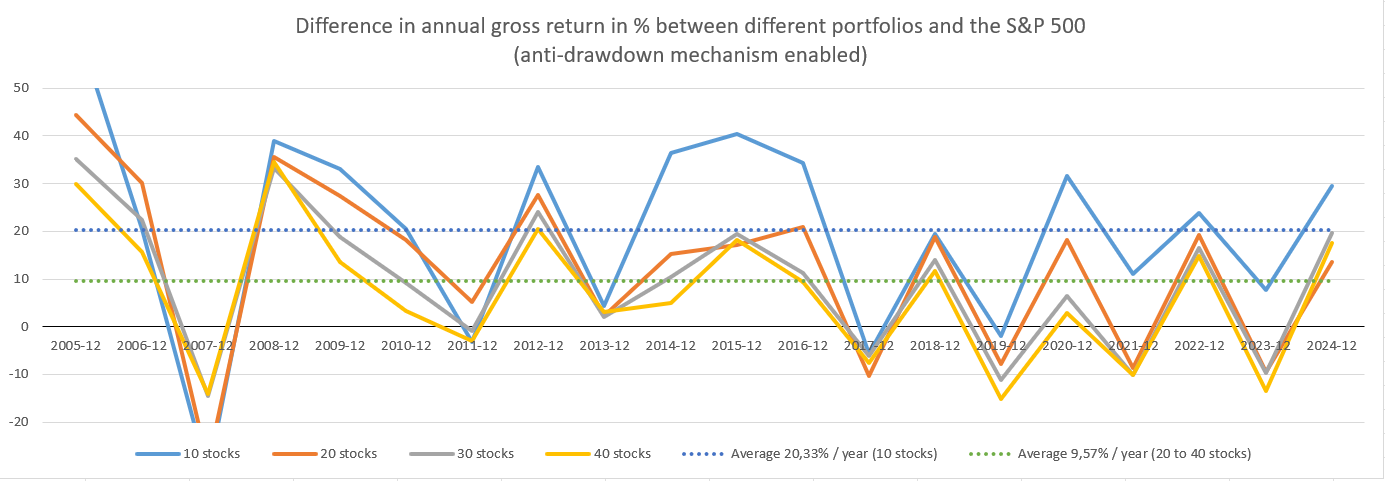
Following the same principle as in a previous chapter, it is possible to compare the outperformance of this portfolio with the SP500 (only for the 2005-2024 period).
By averaging these years, we can obtain the outperformance or average gross annual performance gain relative to the SP500, which is around 9% for a portfolio of 20 to 40 stocks with the anti-drawdown mechanism activated (in green dashed on the graph), and 20% for a portfolio of 10 stocks (in blue dashed on the graph).
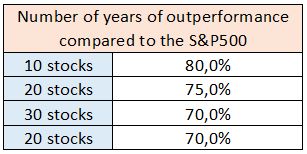
We also observe in the following table that, in general, this World portfolio outperforms the SP500 75% of the time. This refers to all the instances in the graphs above where the performance gap is greater than 0.
Finally, we can observe here the gross performance of this World portfolio for the 2005-2024 period, filtered through the Sharpe ratio and compared with the performance of European and USA portfolios. No after-tax performance is shown here because there are too many possible scenarios.
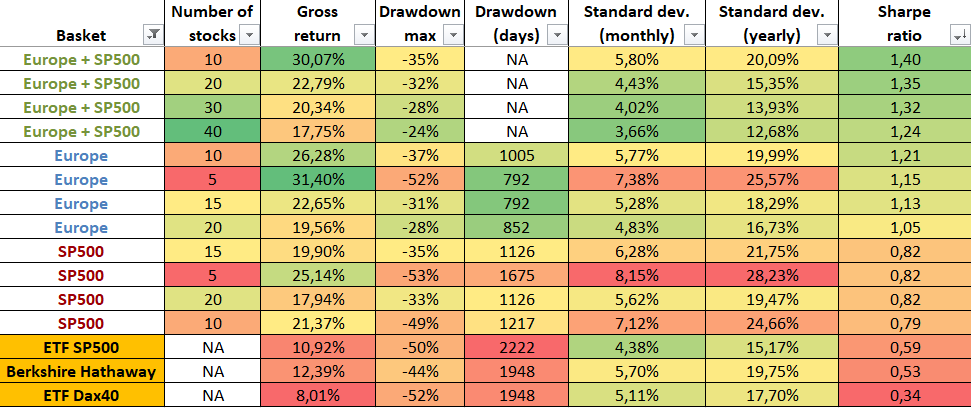
We see that the World portfolio outperforms everyone with at least 20% gross return for a very acceptable volatility, at the cost of a bit more work. This is actually my preferred one, with 10+10 stocks, which strikes a good balance between performance, risk, and time spent on rebalancing.
Next article: Performance of an individual stock