What is the risk?

Volatility, which is inevitable in the stock market, is generally associated with risk. Here, I prefer to talk about costs, the price to be paid, or the unavailability of capital.
Considering the desire to achieve a return of 2% per month, we can plot this 2% return and simultaneously the actual return of a portfolio invested in 10 stocks in Europe.
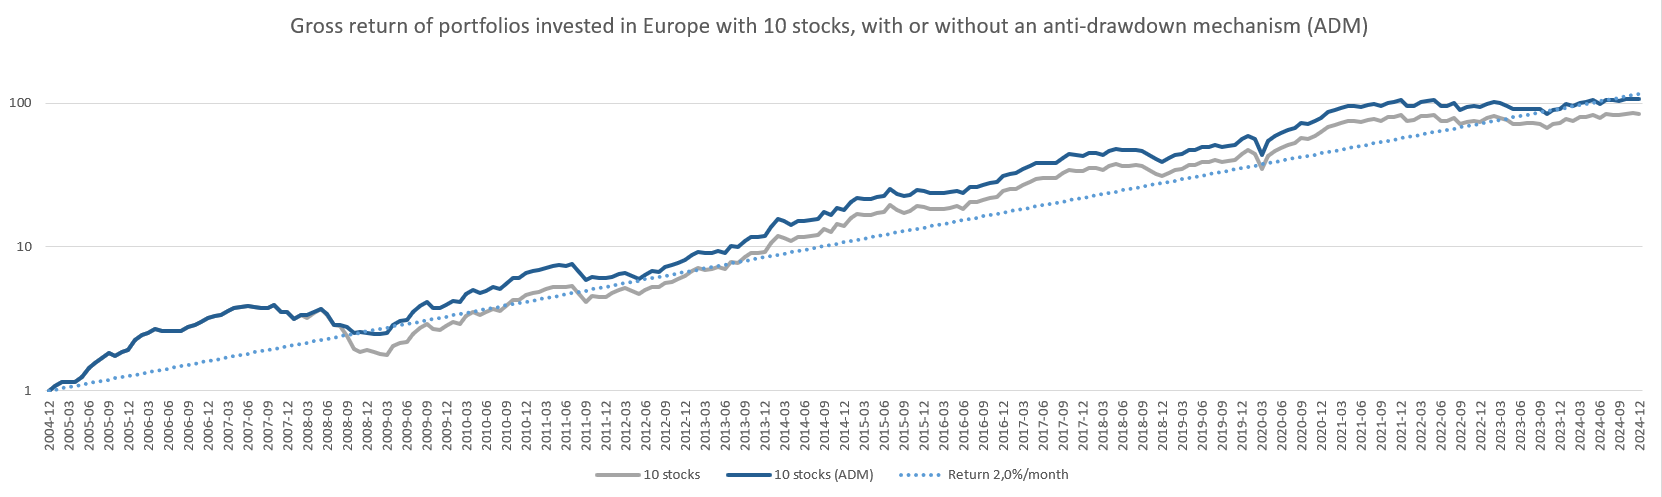
Volatility is the tendency to deviate from the average return. The risk is not knowing whether, when placing or withdrawing capital from this portfolio, the return will be above or below the average. One could imagine starting an investment at the worst time (during a peak) or at the best time (during a trough). Or, one could exit an investment to buy a house, for example, at the worst time (during a trough) or at the best time (during a peak).
A possible philosophy to manage this volatility is to consider it as the fee to pay to access substantial performance. Making money in the markets will never be free; it comes at a price, just like any other product. No one forces you to pay this price—you can choose instead to stay in a savings account, but at the cost of a lower return. In practice, each monthly variation in the portfolio should be seen as the cost of achieving a higher return, a sort of admission fee. And this cost is paid every time you check the portfolio's performance—once a month for the most cautious or several times a day for the more anxious.
One possible strategy to reduce stress is Dollar Cost Averaging (DCA), which involves gradually increasing or decreasing the amount invested over 6 to 12 months to average the risk of investing or disinvesting during a peak or trough. For example, you might invest €1000 in the first month, €2000 in the second month, and so on, until reaching the €10,000 goal in 10 months.
Another possible strategy is to set objectives with this capital, keeping in mind that it is virtually “locked” as long as we are in a market trough, making it inaccessible for buying a house. But during certain periods of bull markets or even peaks, it may be wise to pull out the capital and benefit from it. The risk would then be seen as not being able to exactly master the optimal year to withdraw the capital.
Standard deviation
This volatility indicator helps to roughly estimate how much the monthly or yearly performance of an investment may vary. For example, for a portfolio of 10 stocks invested in Europe, this monthly standard deviation is 5.77% with the anti-drawdown mechanism activated. Another way to visualize this is by looking at the overall monthly performance on a graph for this same portfolio, trying to find the upper and lower boundaries that encompass the majority of these variations:
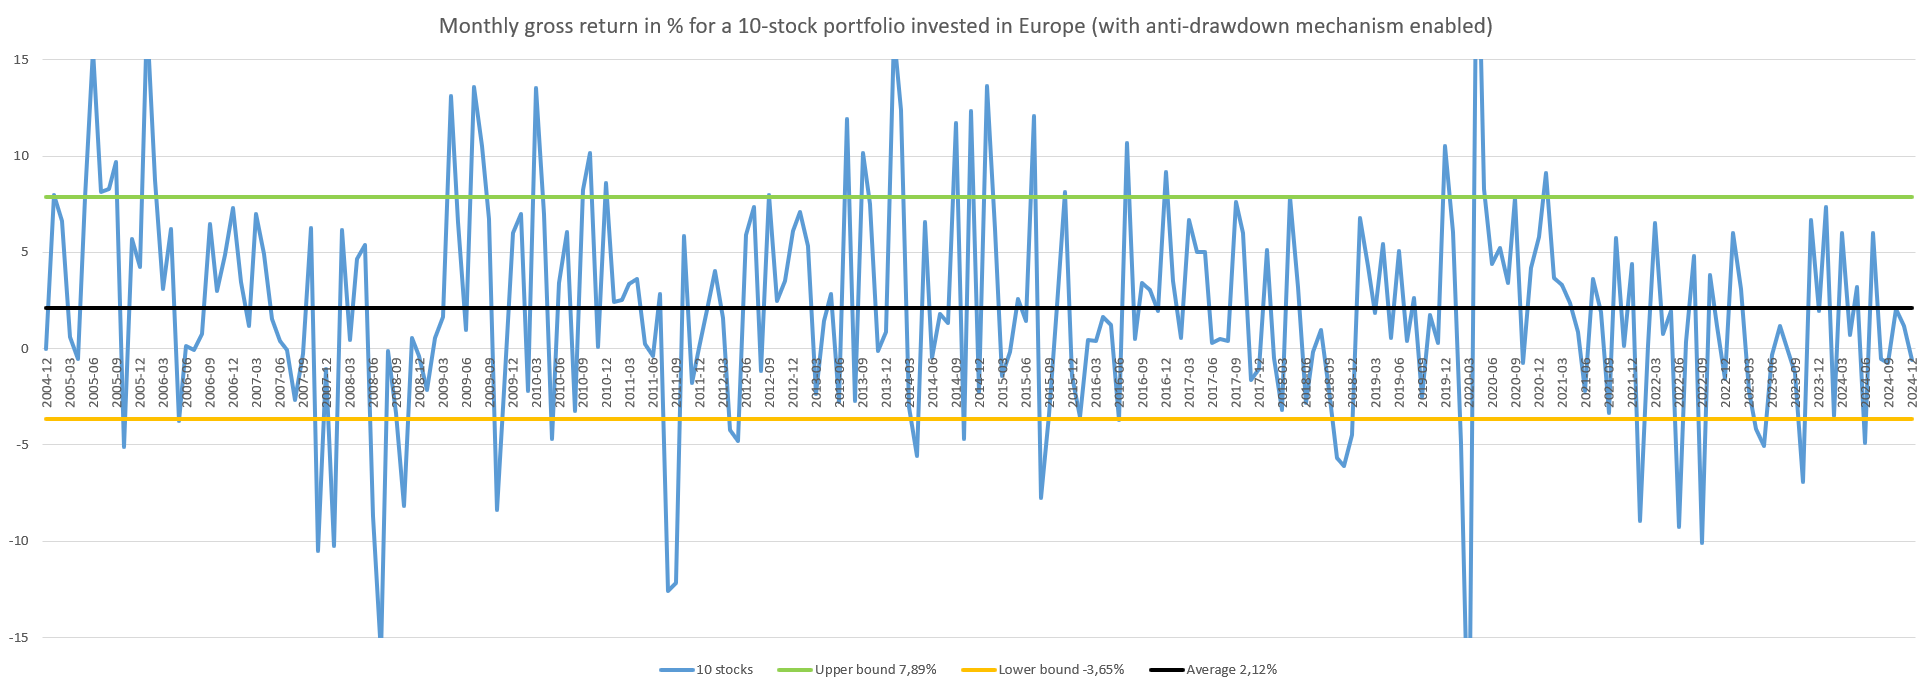
The average of these monthly performances is 2.12%, so generally, the portfolio has a positive return of 2.12% per month, with significant fluctuations depending on the month. By adding or subtracting the standard deviation of 5.77%, we can draw these upper and lower boundaries, which are 7.89% and -3.65%. It is reasonable to expect that the performance of this portfolio will typically fluctuate between -3.65% and 7.89%, although sometimes the performance stays in negative territory for several months (from June to October 2008) or positive territory (from August to September 2020).
It is therefore interesting to invest in this portfolio (with an average return of 2.12% per month), but the cost to pay will be experiencing a volatility of 5.77% both upward and downward, or a monthly performance that fluctuates between -3.65% and 7.89% in most cases.
The calculation can also be done in the reverse direction, considering a portfolio with an annual return R, so the monthly return = (1+R)^(1/12)-1, and considering a monthly volatility V, we get a max = (1+R)^(1/12)-1+V and a min = (1+R)^(1/12)-1-V, which will be the monthly variations that we will observe most of the time.
So with, for example, a return of 10% annually and 3% of monthly volatility, we get max = (1+0.10)^(1/12)-1+0.03 = 0.038 and min = (1+0.10)^(1/12)-1-0.03 = -0.022
We can thus expect monthly variations most of the time between -2.2% and +3.8%. However, the calculation does not indicate that they will be balanced monthly, so there may be 3 or 6 consecutive months of negative variations or positive variations. The calculation just indicates that extreme variations are unlikely, although they will probably occur but at low frequencies.
For reference, we multiply the monthly volatility by the square root of 12 (about 3.46) to obtain the annual volatility.
Performance distribution
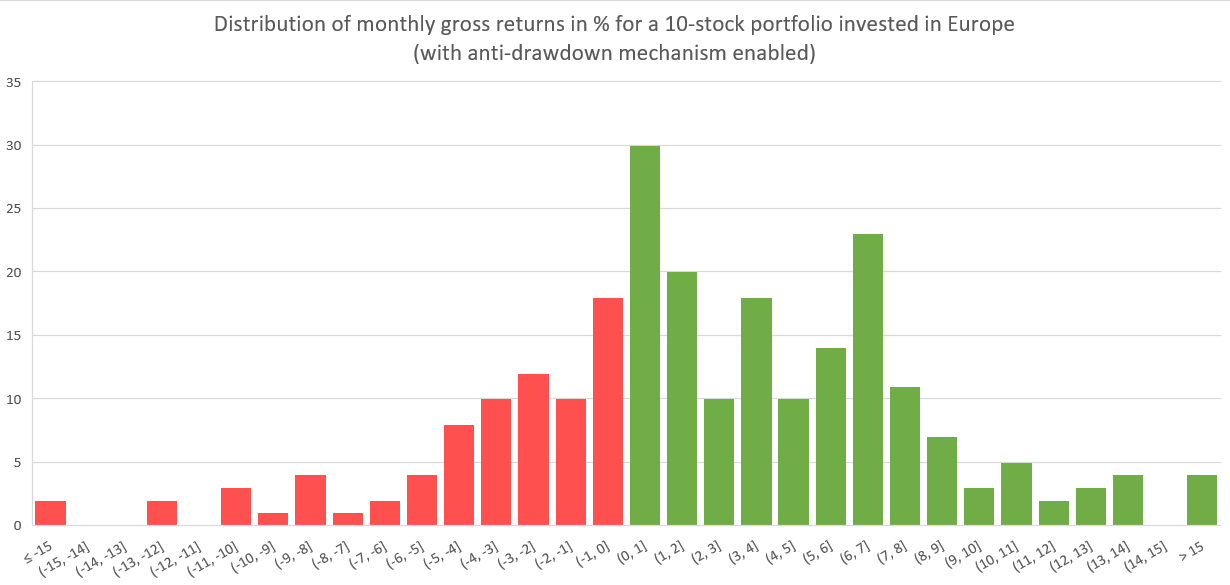
Another way to understand things would be to look at the distribution of monthly performances for this same portfolio, i.e., how many times the portfolio has achieved a performance between 0% and 1%, and how many times between 1% and 2%, etc. I have plotted this graph by marking the negative periods in red and the positive ones in green. Visually, we see that the majority of the performances lie between -5% and +8%.
In practice
This volatility may seem quite abstract, and the best way to understand it is to look at the rebalancing done in recent months (the oldest ones are freely available to all subscribers) to better estimate the portfolio volatility we can expect, and especially the one we are comfortable with to sleep peacefully without stress.
Next article: Porfolios compared to indices